
Fig. 5.
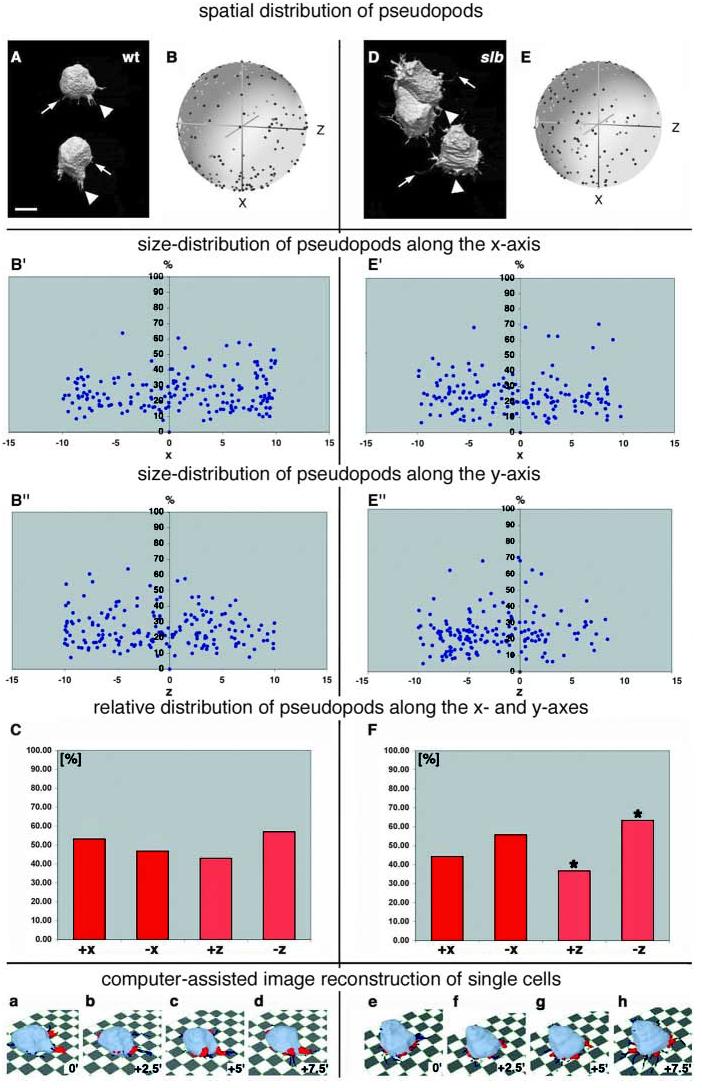
Distribution of processes in wild-type and slb epiblast cells overlying the presumptive prechordal plate at the onset of gastrulation. Cells were labelled with a mixture of cytosolic and membrane-bound GFP and visualised in 3D over time by two-photon confocal microscopy. (A,D) 3D images of typical epiblast cells in a wild-type (A) and slb mutant (D) embryo moving from top (animal pole) to bottom (germ ring margin) at shield stage. Arrowheads point to thick, pseudopod-like processes. Arrows mark smaller, filopod-like processes. In A, the pseudopod emerging from the upper cell is branched. (B,E) Spherical plots showing the distribution of the outgrowth positions of pseudopods (blue dots) relative to the cell centroid and normalized to the movement direction of the cells (black dot) in wild-type (B) and slb mutant (E) embryos at shield stage (see Fig. 4 for further information on spherical plots). The process positions of 20 cells (from four timepoints in wild type and the first three timepoints in slb) or from 11 cells (last timepoint in slb) from five wild-type and eight slb embryos at four consecutive timepoints (0, 2.5, 5 and 7.5 minutes) were plotted into one diagram. Note that the x, y and z axes in these diagrams show the coordinates relative to the movement direction of individual cells (+x axis), whereas in Fig. 3, these axes depict the global coordinates within the gastrula. (B′,B″,E′,E″) Distribution of pseudopod lengths from B and E, respectively, along the x-axis (B′,E′) – the individual movement axis of the cells – or the z-axis (B″,E″). Each diagram shows pseudopod lengths relative to the body length of the corresponding cell (in %); the numbers on the ordinate axis correspond to arbitrary units, with x=10 being the radius of the spheres in (B) and (E). (C,F) Distribution of the outgrowth positions of pseudopods in wild-type (C) and slb embryos (F). The columns show the relative distribution of pseudopods along (+x versus –x) and perpendicular (+z versus –z) to the individual movement direction of the cells, averaged over four consecutive timepoints (0, 2.5, 5 and 7.5 minutes), with the cell centroid at x=0 and z=0. The insets show examples of wild-type (a-d) and slb (e-h) epiblast cells, with cell bodies in light blue and pseudopods in red. The corresponding timepoints are indicated. The dark blue structures are thin, filopod-like processes. *, P<0.05, paired Student's t-test. Scale bar in A: 10 μm.