
Figure 2. Stimulation with carbachol increases PKCe colocalization with apical actin in lacrimal acini.
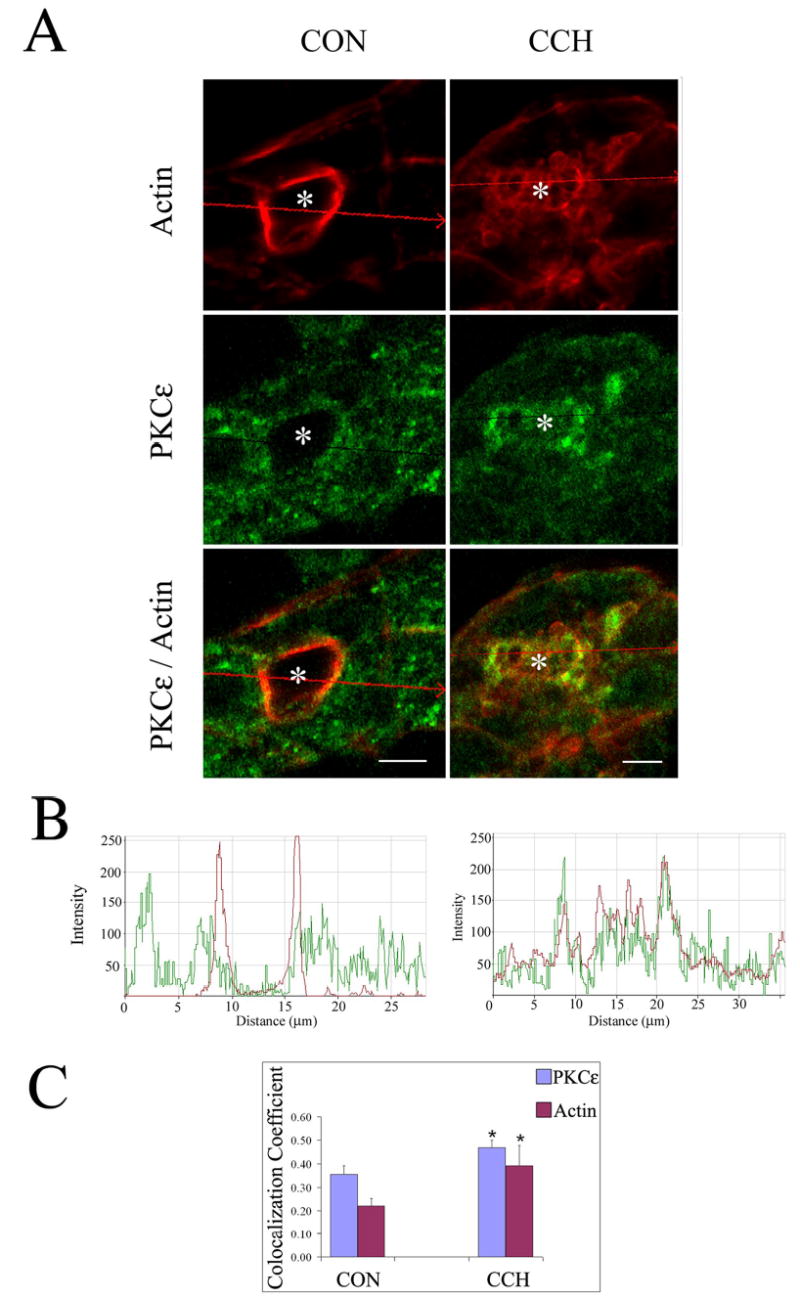
A. Confocal micrographs of control (CON) and CCH-stimulated (CCH; 100 μM, 5 min) acini processed as described in Methods to label PKCe (green; rabbit polyclonal antibody to PKCe, secondary antibody- goat anti-rabbit-FITC) and actin (red; rhodamine phalloidin) which are displayed as separate signals and also as overlaid images. Red arrows across the images indicate the linear region of focus and the direction of the displayed signals from left to right for the intensity plots in B. *, lumenal regions and bars, 5 μm. B. Intensity plots showing the relative intensity of green (PKCe) and red (actin) fluorescence in the regions indicated from the images in A. Regions exhibiting coincident peaks are increased by CCH stimulation, suggestive of increased colocalization. C. Colocalization coefficients which express, for each marker, the number of colocalizing pixels over the number of total pixels, were calculated as described in Methods from unstimulated acini (CON) or acini exposed to CCH (5 min, 100 μM). The relative number of colocalizing pixels in channels 1 or 2, respectively, are expressed as compared to the total number of pixels above threshold. The value range is from 0 – 1 where 0 indicates no colocalization and 1 indicates that all pixels colocalize. All pixels above background count irrespective of their intensity. Results were obtained from 45 (CON) and 47 (CCH) lumena acquired randomly over n=4 separate preparations (7–20 lumena per preparation), *, significant at p ≤ 0.05.