
Figure 6. CCH stimulation of lacrimal acini transduced with Ad-syncollin-GFP depletes subapical syncollin-GFP fluorescence.
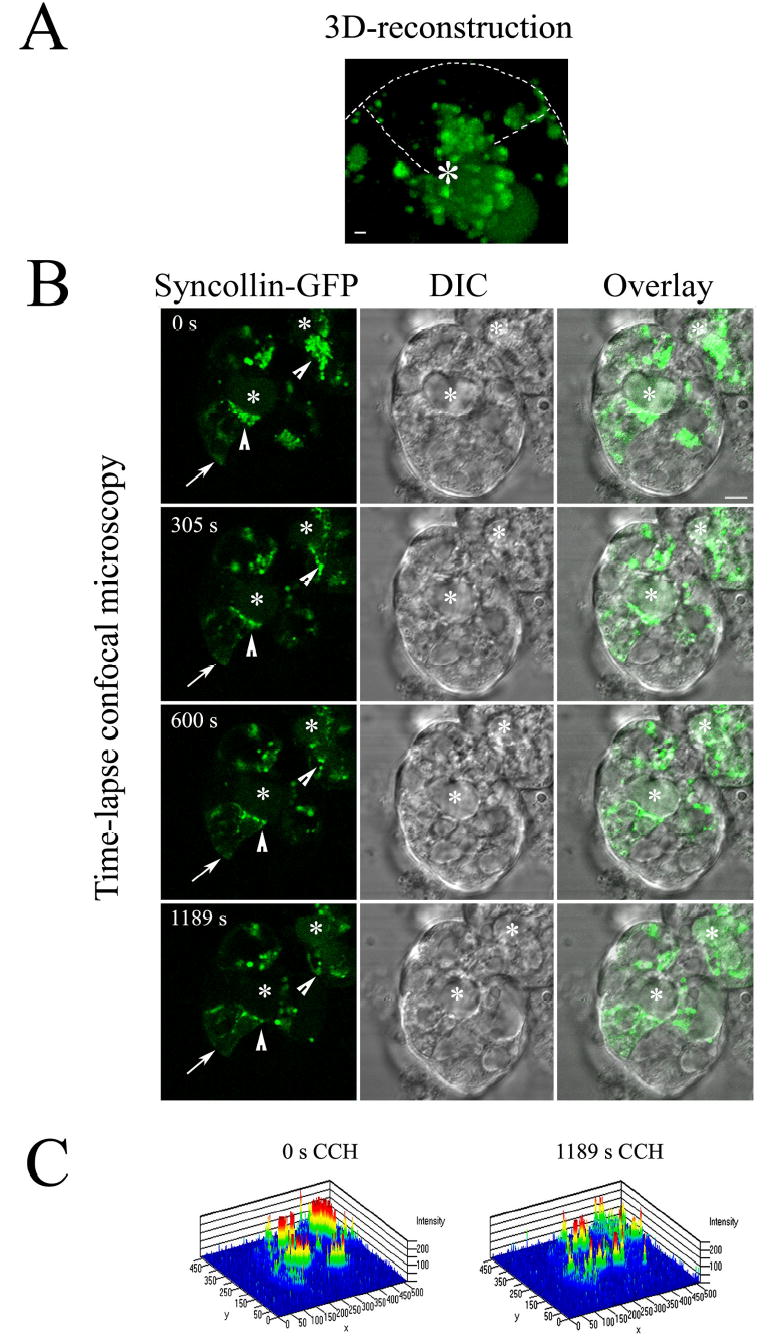
Lacrimal acini grown on Matrigel-covered glass-bottomed round 35 mm dishes were transduced with Ad-syncollin-GFP on day 2 of culture as described in Methods and imaged on day 3 of culture. A. 3D reconstruction at high magnification of the interior regions of a reconstituted acinus formed by three lacrimal acinar cells organized around a central lumen (*), each expressing syncollin-GFP. The reconstruction was obtained by compression of XY images acquired at Z intervals of 0.5 μm. Bar, 1 μm; dashed line, boundary of uppermost cell relative to the other two, deduced by comparison to DIC image. B. Live acini were imaged in the presence of CCH (100 μM) at the indicated times by time-lapse confocal fluorescence microscopy. Arrowheads indicate regions of major loss of syncollin-GFP intensity surrounding lumenal regions (*); bar, 5 μm. No major changes in syncollin-GFP intensity were observed when acini were imaged without CCH. C. 2.5 D graphical reconstruction of the overall intensity profile of the imaged areas presented in A. at 0 and 1189 sec of stimulation with CCH, illustrating individual intensities per pixel utilizing the rainbow scale. The resolution is ~10 pixels per micron.