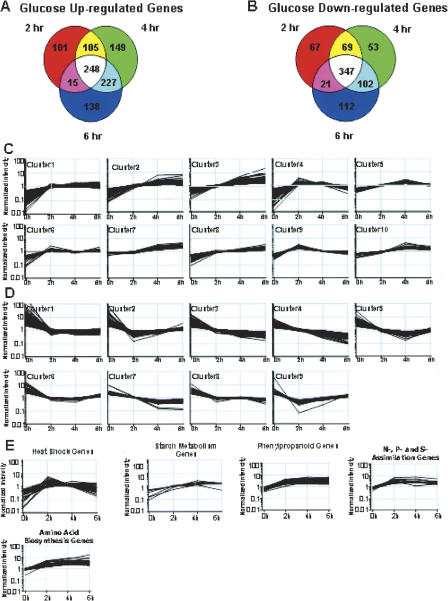
Figure 1.
Expression dynamics of glucose-responsive genes. (A) Venn diagrams showing the number of genes up-regulated by glucose at 2-h, 4-h, and 6-h time course points determined by microarray analyses. Here, 248 genes were up-regulated by glucose at all time points; 353 genes were induced by glucose at both 2 h and 4 h; 475 genes were up-regulated by glucose at both 4 h and 6 h; and 263 genes were glucose inducible at both 2 h and 6 h. (B) Venn diagrams showing the number of genes down-regulated by glucose at 2-h, 4-h, and 6-h time points determined by microarray analyses. Here, 347 genes were down-regulated by glucose at all time-course points; 416 genes were down-regulated by glucose at both 2 h and 4 h; 449 genes were repressed by glucose at both 4 h and 6 h; and 368 genes were glucose repressible at both 2 h and 6 h. (C) The expression profiles of glucose-inducible genes according to Quality Threshold clustering. Cluster number and time course are indicated. (D) The expression profiles of glucose-repressible genes according to Quality Threshold clustering. Cluster number and time course are indicated. (E) The expression profiles of heat-shock genes, starch metabolism, phenylpropanoid biosynthesis, N-, P-, and S-assimilation genes, and amino acid biosynthesis genes are shown.

