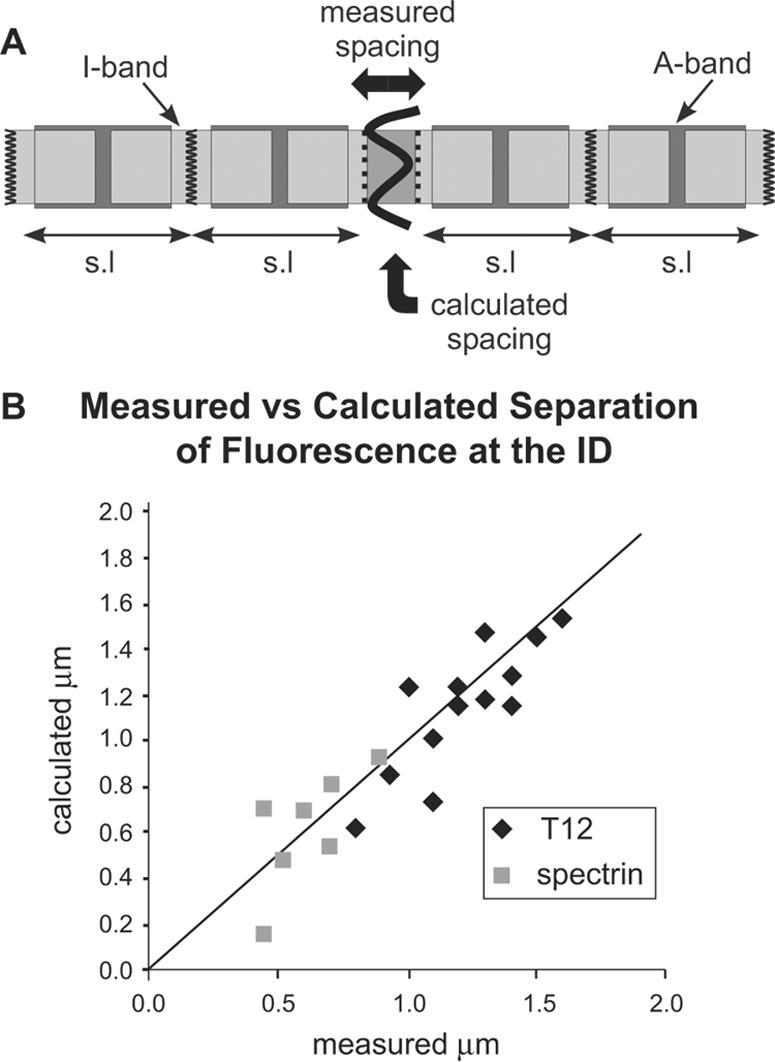
Figure 4.

(A) Diagram of the folds of the intercalated disc and its associated myofibrils. Arrows show the how measured and calculated spacings of the fluorescent doublet across the ID were determined (see Materials and Methods). (B) Plot of the measured separation of the doublet against the calculated value for αII spectrin and titin T12 antibodies. The straight line passes through the origin and has a slope of 1.
