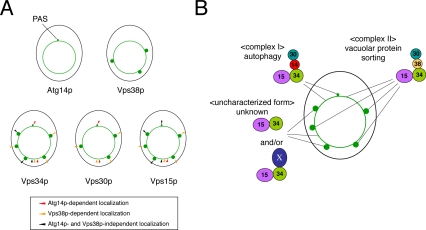
Figure 10.
Distinct distribution of the two PI3-kinase complexes. (A) The intracellular localization of each component of the PI3-kinase complexes is shown in green, whereas the outline of the cell is detailed in black. (B) The distribution of the PI3-kinase complexes is summarized. “X” represents an unknown component(s).

