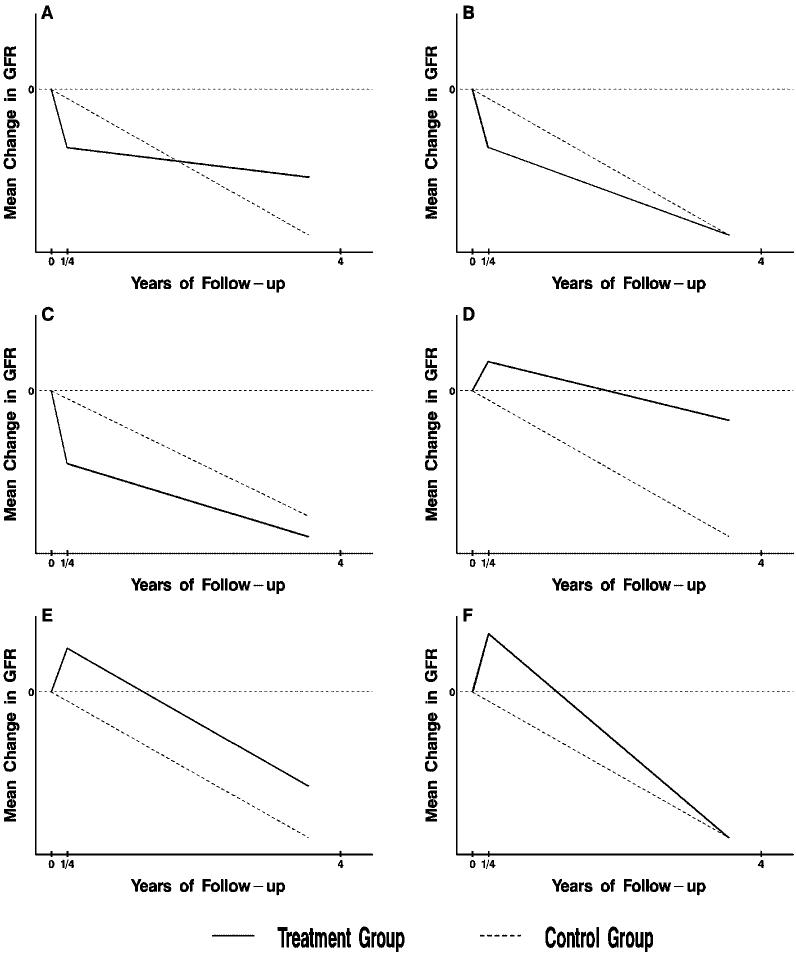
Figure 1.
Possible scenarios for the comparison of two treatment groups. Shown are six alternative scenarios for the effects of a treatment compared with a reference group on the mean change in GFR from baseline to 4 yr under the two-slope model. The chronic slope is depicted by the slope from 3 mo (1/4 year) to 4 yr, and the total mean slope as the average rate of change from baseline to 4 yr. Panels A and D represent definitive scenarios in which the comparisons between treatment groups of the mean chronic and total slopes are in agreement. The remaining panels depict inconclusive scenarios in which the comparisons of the chronic and total means slopes are not in agreement.

