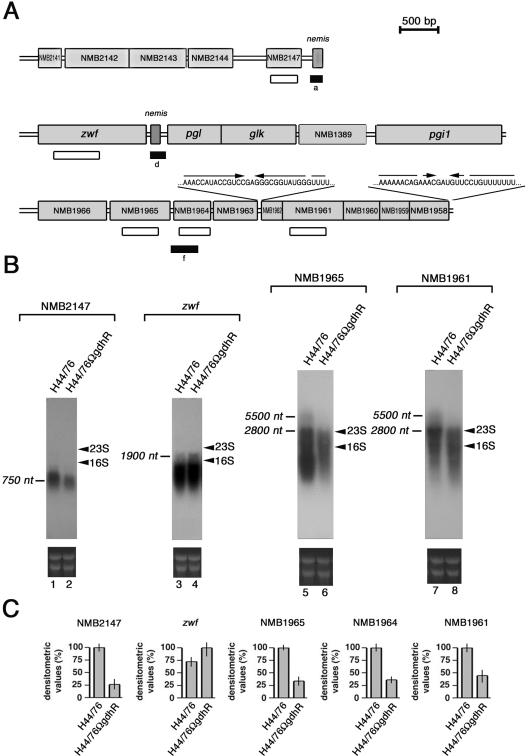
FIG. 2.
Genetic map of GdhR-regulated loci and Northern blot analysis. (A) The position of the cDNA (closed rectangles) corresponding to either up-regulated (d) or down-regulated (a and f) genes in the GdhR-defective strain is indicated with respect to the available genetic map of MC58 (44), an ET-5 strain phylogenetically related to H44/76 (35). Open rectangles locate the NMB2147-, the zwf-, the NMB1965-, the NMB1964-, and the NMB1961-specific probes used in Northern blot (B) and slot blot (C) experiments. The RNA sequences of the palindromic elements mapping in the intercistronic NMB1963-NMB1962 region and at the 3′ end of NMB1958 are reported. (B) Northern blot analysis of GdhR-regulated transcripts in isogenic strains H44/76 and H44/76ΩgdhR. Top, H44/76 (lanes 1, 3, 5, and 7) and H44/76ΩgdhR (lanes 2, 4, 6, and 8) were grown to late logarithmic phase (OD550 of 0.8) in complex GC medium. Total RNAs (10 μg) were extracted and analyzed by Northern blotting using the 32P-labeled NMB2147-, zwf-, NMB1965-, and NMB1961-specific probes shown in panel A. Bars indicate GdhR-regulated transcripts whose approximate sizes were deduced on the basis of the relative migration of 23S and 16S rRNA (arrowheads). Bottom, Ethidium bromide staining of ribosomal RNAs is reported as a loading control. (C) Relative levels of NMB2147-, zwf-, NMB1965-, NMB1964,- and NMB1961-specific mRNAs in strains H44/76 and H44/76ΩgdhR determined by slot blot experiments. For NMB2147, NMB1965, NMB1964, and NMB1961, transcript levels in H44/76 are arbitrarily assumed to be equal to 100%. For zwf the transcript level in H44/76ΩgdhR is assumed to be equal to 100%. Values represent means from three independent experiments, each with triplicate samples. Bars indicate standard deviations.

