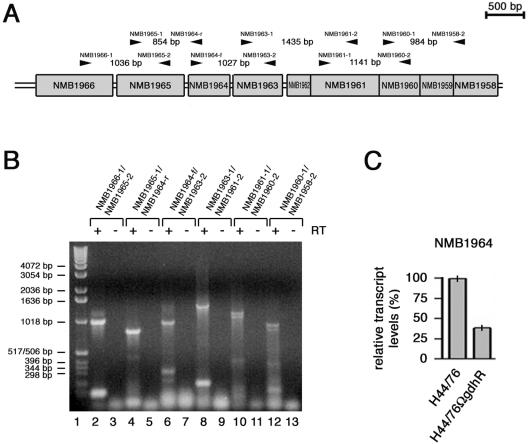
FIG. 3.
Linked RT-PCR and RT real-time PCR analyses of the NMB1966-to-NMB1958 region. (A) Genetic map of the NMB1966-to-NMB1958 region with the positions of the primer pairs (arrowheads) used in linked RT-PCR experiments. (B) Linked RT-PCR experiment. Total RNA from H44/76 grown to late logarithmic phase (OD550 of 0.8) in complex GC medium was analyzed by RT-PCR using the following primer pairs: NMB1966-1/NMB1965-2 (lanes 2 and 3), NMB1965-1/NMB1964-r (lanes 4 and 5), NMB1964-f/NMB1963-2 (lanes 6 and 7), NMB1963-1/NMB1961-2 (lanes 8 and 9), NMB1961-1/NMB1960-2 (lanes 10 and 11), and NMB1960-1/NMB1958-2 (lanes 12 and 13). In lanes 3, 5, 7, 9, 11, and 13, Superscript RT was omitted as a control. The relative migration of DNA molecular weight ladders (lane 1) is indicated (bars on the left). (C) Semiquantitative analysis of the NMB1964-specific transcript in H44/76 and H44/76ΩgdhR by RT real-time PCR experiment. The RNA was extracted from meningococci grown to late logarithmic phase (OD550 of 0.8) in GC medium. Results were normalized to 16S rRNA levels. Transcript levels in H44/76 are arbitrarily assumed to be equal to 100%. Values represent means from five independent experiments with triplicate samples using distinct cDNA preparations for each RNA sample ± standard deviations.

