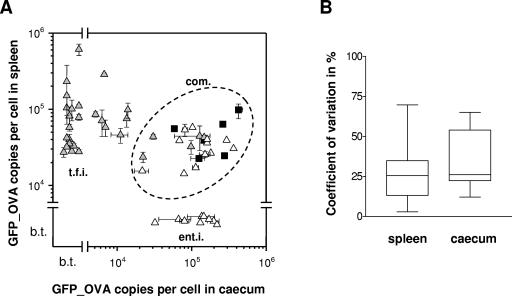
FIG. 2.
(A) Salmonella promoter activities in murine colitis (cecum) and typhoid fever (spleen) models. Promoter fusions were originally obtained from flow cytometric sorts of infected cecal lumen (open triangles) or spleen (gray triangles). For comparison, activities of five ribosomal promoters are also shown (black squares). b.t., below detection threshold; com, commonly active promoters; ent.i., enteritis induced; t.f.i., typhoid fever induced. Error bars indicate the range of repeated measurements. (B) Coefficient of variation of results obtained from repeated measurements of individual promoter-gfp_ova fusions in typhoid fever (spleen) and enteritis (cecum) models. The plots shows ranges (whiskers) and quartiles (the boxes extend from the 25th percentile to the 75th percentile, and the lines within boxes depict the medians).

