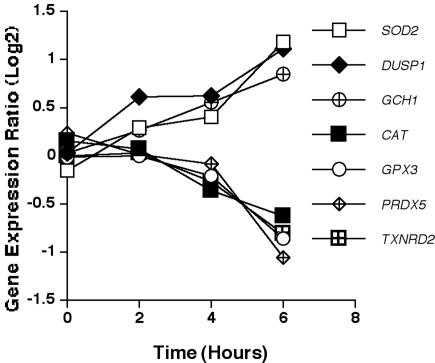
FIG. 7.
Expression of oxidative response genes. Mean expression ratio (log2) kinetics of genes encoding oxidative stress response molecules in HMCs in response to conidia of A. fumigatus (P ≤ 0.05 for peak change compared to T0). Results for the following genes are shown: SOD2 (superoxide dismutase 2), DUSP1 (dual-specificity phosphatase 1), GCH1 (GTP cyclohydrolase 1), CAT (catalase), GPX3 (glutathione peroxidase 3), PRDX5 (peroxiredoxin 5), and TXNRD2 (thioredoxin reductase 2).

