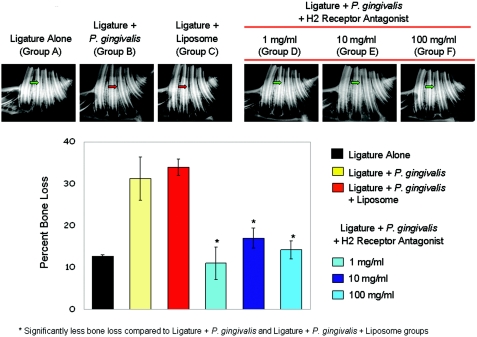
FIG. 4.
Radiographic analyses of bone and other hard tissue components. The upper panel demonstrates the bone loss in animals that had received ligature placement plus P. gingivalis and in animals that had received ligature placement plus P. gingivalis and vehicle (liposome) (groups B and C). The green arrow depicts the normal bone level, while bone loss (red arrow) is visible and significantly different than in animals that had received ligature alone (group A, green arrow). The lower panel depicts the percentage of bone loss as calculated by the Bjorn technique. Significant differences were found with cimetidine compared to liposome plus ligature or ligature alone (*, P < 0.05).

