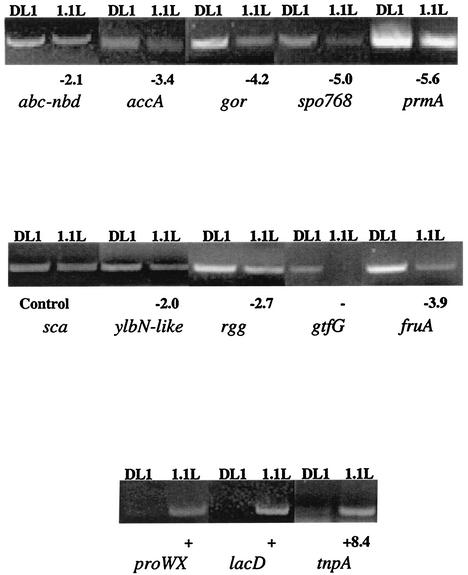
FIG. 5.
RT-PCR analysis of mRNA expression of the indicated genes in S. gordonii DL1 and 1.1L. The results are representative of three separate preparations of total RNA. Fold induction or repression in 1.1L is indicated numerically or as “+” or “−” to show that mRNA expression could not be detected in either DL1 or 1.1L, respectively. The ratio of induction or repression in 1.1L was calculated from the relative intensity of linear range amplification products of RNA from DL1 and 1.1L normalized levels of sca mRNA (control) that was not regulated in 1.1L.

