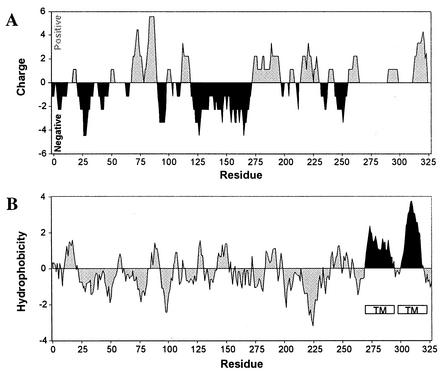
FIG. 1.
Charge distribution and hydropathy profile of the ZntB sequence. (A.) Regions of positive and negative charges were calculated by summing pK values of amino acids within a 15-residue sliding window. Regions with positive charge density are shaded grey, while regions with negative charge are shaded black. (B.) Hydropathy was determined by the algorithm of Kyte and Doolittle using a sliding window of 15 amino acids. Regions predicted to form transmembrane (TM) structures are denoted by open boxes.

