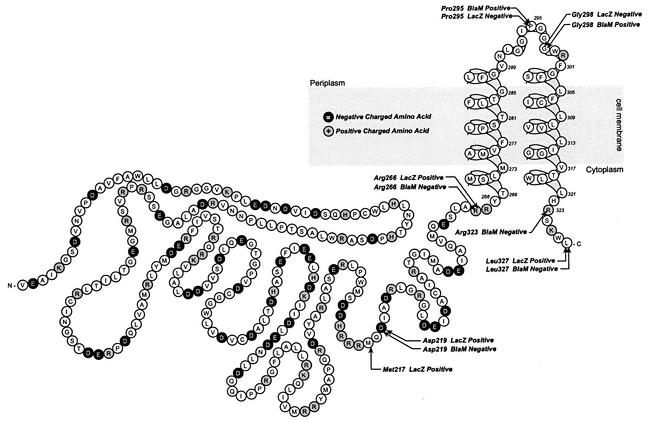
FIG. 2.
Model of the membrane topology of ZntB. Individual amino acids are depicted in single-letter code. Positively charged residues are enclosed in grey circles; negatively charged residues are enclosed in black circles. Locations of BlaM and LacZ fusions are labeled. The text following each fusion indicates the phenotype of the strain containing the plasmid encoding the chimera.

