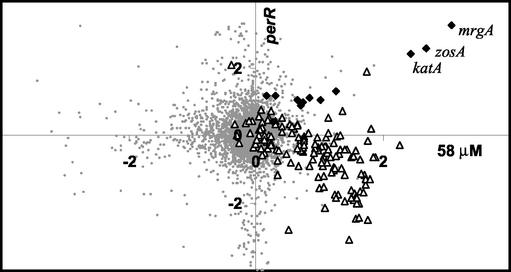
FIG. 5.
Graphical comparison of the H2O2 stimulon and the effects of the perR mutation. The log2 of the induction ratio at 3 min after exposure to 58 μM H2O2 (x axis) is compared with the log2 of the ratio of induction in the perR mutant to induction in the wild type (y axis). Members of the PerR and σB regulons are indicated by solid diamonds and open triangles, respectively. The three most strongly regulated members of the PerR regulon are labeled. Note that PerR-regulated genes are in the upper right quadrant (these genes derepressed in the perR mutant and peroxide inducible in the wild type).

