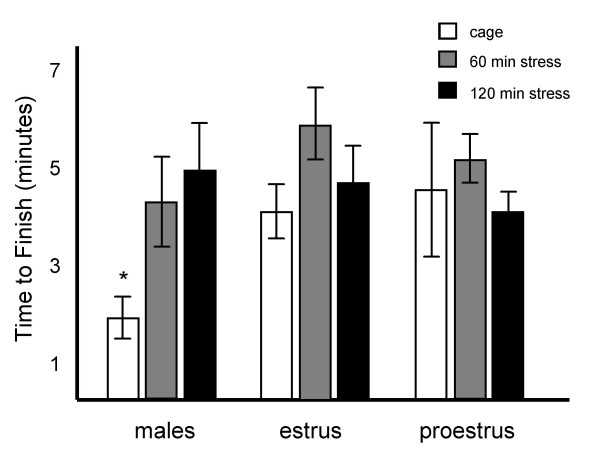
Figure 3.
Group differences in time were observed, but they did not correlate with differences in performance. Task completion times were recorded for all groups. Results are represented as mean +/- SEM minutes to finish. Mean task completion times (in minutes) after 0, 60 and 120 min were 1.8 +/- .4, 4.5 +/- 1.1 and 5 +/- 1 for males; 4.3 +/- .5, 5.8 +/- .7 and 4.8 +/- .64 for females in estrus; and 4.7 +/- 1.6, 5.3 +/- .6 and 3.9 +/- .4 for females in proestrus. * = significantly different from all other groups.

