
Figure 7.
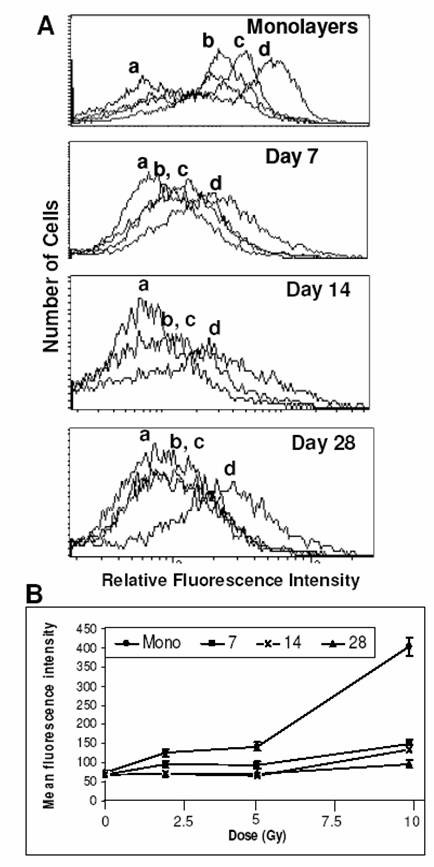
Oxidative stress by flow cytometry. (A) Generation of ROS measured by H2DCFDA technique in BMG-1 monolayers and spheroids. Untreated control (a), 2 Gy (b), 5 Gy (c) and 10 Gy (d). (B) Dose response of ROS generation in monolayers and spheroids. Average values of the mean fluorescence intensities (MFI) of H2DCFDA were obtained from three independent observations.