
Figure 6.
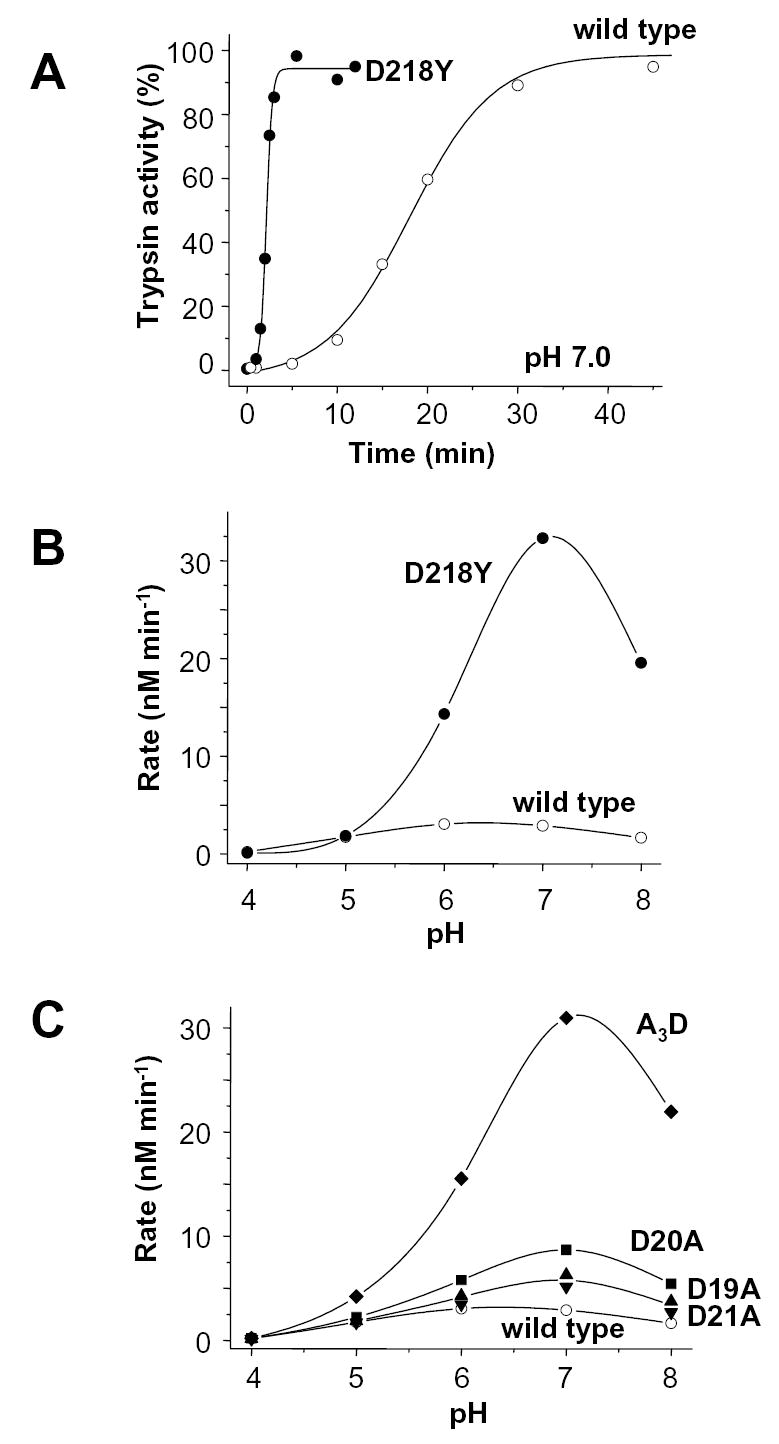
Autoactivation of wild-type (open symbols) and D218Y (solid symbols) human cationic trypsinogen. A. Time-courses of autoactivation were followed at 37 °C in 0.1 M Na-HEPES (pH 7.0), 1 mM CaCl2 and 2 mg/mL bovine serum albumin. Initial trypsinogen and trypsin concentrations were 2 μM and 10 nM, respectively. B. Effect of pH on autoactivation of wild-type and D218Y trypsinogen. C. For comparison, the pH dependence of autoactivation of the activation peptide mutants D19A, D20A, D21A and A3D are also shown (for time-courses at pH 8.0 see Fig 3). Initial rates were calculated from time-courses of autoactivation using progress curve analysis, as described in Experimental Procedures. The buffers used were Na-acetate, (pH 4.0 and 5.0); Na-MES (pH 6.0); Na-HEPES (pH 7.0) and Tris-HCl (pH 8.0).