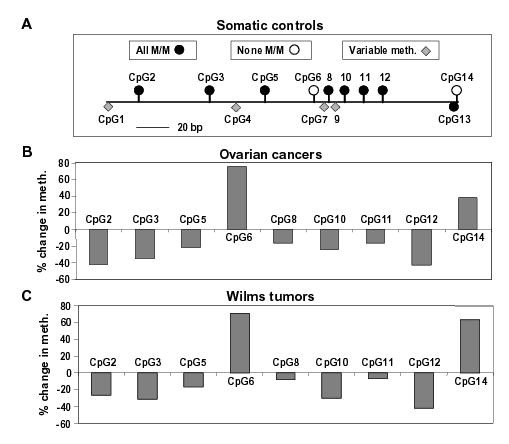
Figure 3.

Comparison of methylation in somatic control tissues (brain, spleen, and lung), ovarian carcinomas, and Wilms tumors. (A) Cartoon illustrating to scale the positions of the CpG sites in the hairpin GS region and their methylation status in the somatic controls. The 7 CpG’s that were always M/M and the 2 CpG’s that were either always U/U (CpG14) or usually U/U and occasionally hemimethylated (CpG6) are shown above the horizontal line. The variably methylated CpG’s are shown as diamonds below the line. The filled-in circle below the line represents CpG13, which was always methylated when present, but often not present due to germline sequence variation. (B) and (C) show the overall change in methylation in five ovarian carcinomas and five Wilms tumors at CpG’s that were either always M/M or never M/M in somatic controls. The % change in methylation at CpG2, 3, 5, 8, 10, 11, and 12 is shown as the negative of the percentage of cancer clones with hypomethylation (loss of M/M status) at that position; for CpG6 and 14, it is the percentage of cancer clones with hypermethylation (gain of M/M status).
