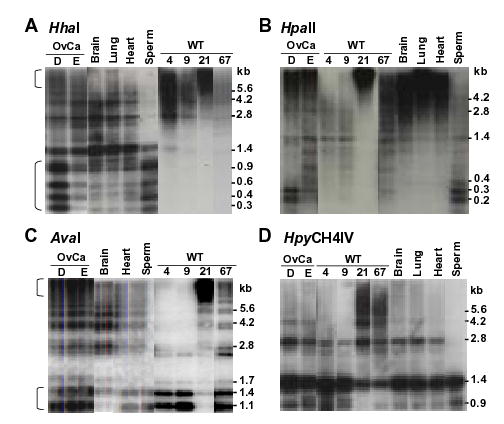
Figure 4.

Representative SB analysis of NBL2 hyper- and hypomethylation in cancer DNAs. Ovarian carcinoma, Wilms tumor, and control DNAs were digested with the indicated CpG methylation-sensitive enzymes and probed with the 1.4-kb NBL2 sequence. The brackets in panels A and C indicate the separate hypermethylated and hypomethylated fractions of NBL2 repeats in OvCaD and in OvCaE although the hypomethylated repeats were more prominent, especially for HhaI digests. Different exposures from the same blot were used for these panels.
