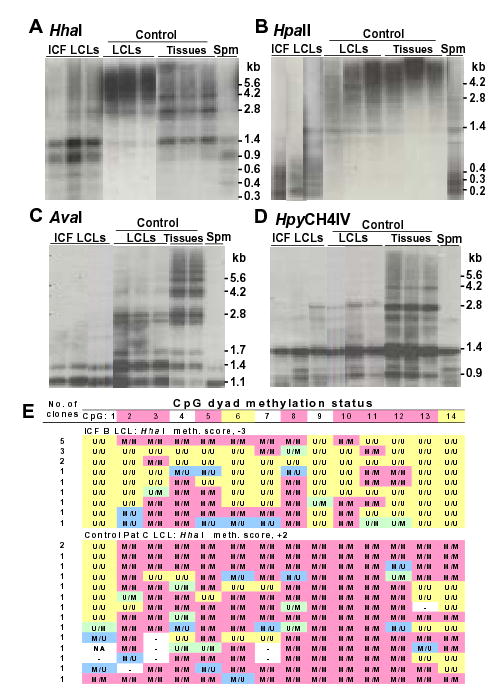
Figure 5.

Analysis of methylation in ICF and control LCLs. (A–D), Southern blot analysis as described for Fig. 5. (E) genomic sequencing as for Fig. 2. The ICF LCLs were ICF B, C, and S and the control LCLs were maternal B, maternal C, and paternal C, respectively, from phenotypically normal parents of ICF patients (45,46). The somatic control tissues for panels A and B were brain, lung, and heart; in panel C, lung and spleen; and in panel D, brain, lung, and spleen. Spm, normal sperm.
