
Fig. 1.
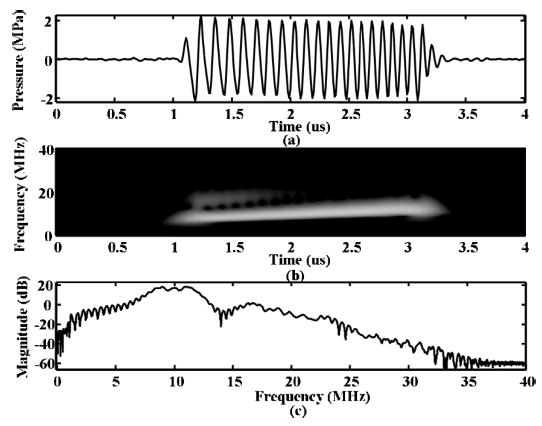
(a) Plot of driving pulse received by the hydrophone filtered by a bandpass filter from 1 to 15 MHz. The y-axis is pressure in megapascals corrected for the frequency response of the hydrophone. (b) Time-frequency power spectrum of the filtered driving pulse received by the hydrophone showing 30 dB of dynamic range. (c) Spectrum of the signal in (a).