
Figure 2.
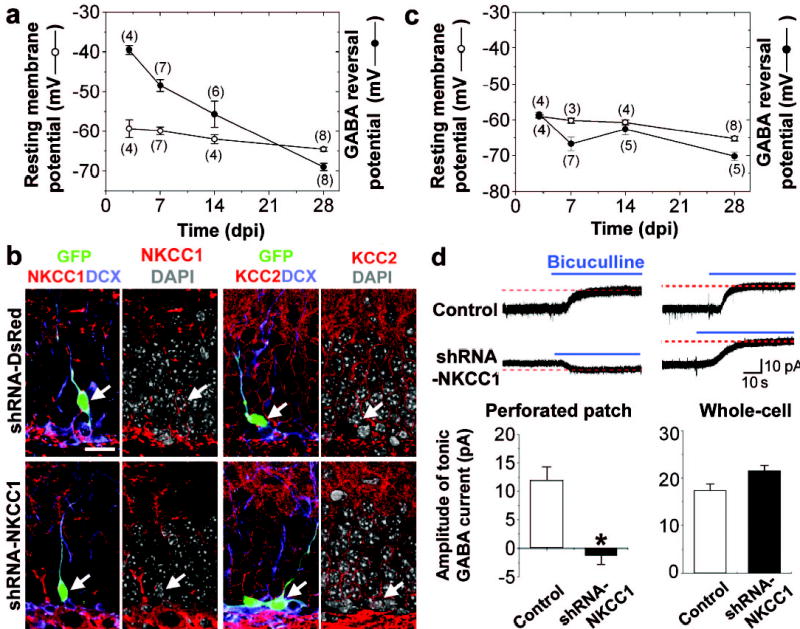
Nature of GABA-induced activation in newborn DGCs in the adult brain. a, Resting membrane potentials (Vrest) and GABA-reversal potentials (EGABA) of GFP+ DGCs. Values represent mean ± s.e.m. Numbers associated with symbols refer to the number of cells examined. b, Retrovirus mediated co-expression of GFP and shRNAs specific for NKCC1, but not a control shRNA (shRNA-DsRed), reduced NKCC1 expression and had no effects on KCC2 expression in newborn DGCs (7 dpi). Shown are confocal images of GFP (green) and immunostaining of NKCC1 or KCC2 (red), DCX (blue) and DAPI (gray), respectively. Arrows point to GFP+ DGCs. Scale bar: 20 μm. c, Vrest and EGABA in shRNA-NKCC1+ newborn DGCs. Similar as in (a). d, Tonic GABA currents in newborn DGCs (7dpi) recorded under gramicidin perforated patch or break-in whole-cell recording (Vm = −65 mV). Blue lines indicate the addition of bicuculline (100 μM). Scale bars: 10 pA and 10 s. Values in the bar graph represent mean ± s.e.m. (n = 6, * p < 0.01, ANOVA).