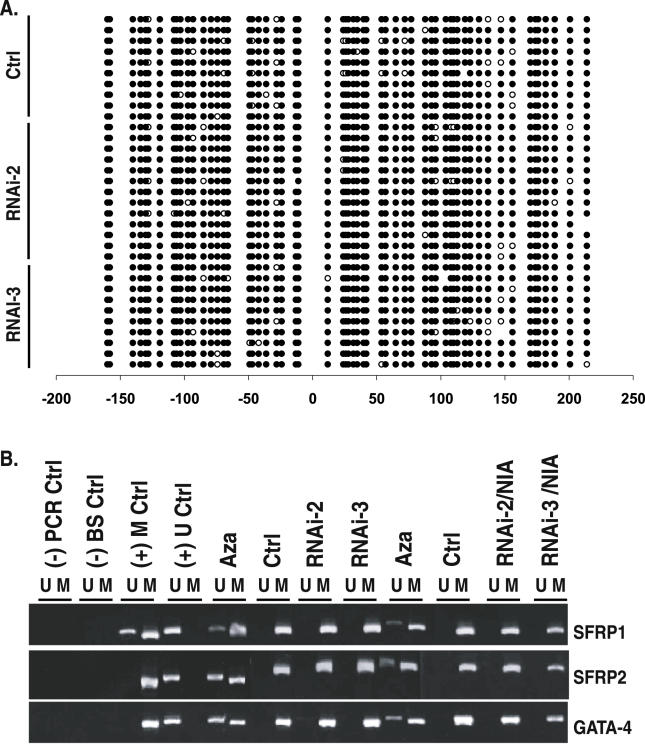
Figure 3. SIRT1 Inhibition Causes TSG Re-Expression without Changing Promoter DNA Hypermethylation.
(A) TSG re-expression occurs without changes in the methylation profile of multiple clones analyzed for SFRP1 promoter methylation. Parallel samples analyzed in Figure 1D were subjected to bisulfite sequencing of the SFRP1 promoter from MDA-MB-231 cells stably infected with control vector or RNAi-2 or RNAi-3 retrovirus. Open circles indicate unmethylated cytosines, and closed circles indicate methylated cytosines. Numbers at the bottom show the position of cytosines relative to the transcription start site, which is at position 0, and those with a minus sign (−) are upstream from this start site. The region sequenced encompasses the CpG island in which methylation status correlates with gene expression status.
(B) MSP analyses of DNA from MDA-MB-231 cells stably expressing vector control, RNAi-2, or RNAi-3 retrovirus. From left to right: (-) PCR Ctrl indicates H2O only; (-) BS ctrl indicates bisulfite-treated H20; (+) M ctrl indicates the cell line in which SFRP1 is partially methylated and SFRP2 and GATA4 are fully methylated; and (+) U ctrl indicates the Tera-2 cell line in which each gene is unmethylated. All remaining lanes are for MDA-MB-231. From left to right: Aza indicates 1 μM Aza (24 h) treatment; Ctrl indicates empty vector infection; RNAi-2 indicates shRNA-2 infection alone; RNAi-3 indicates shRNA-3 infection alone; Aza indicates 1 μM Aza (24 h) treatment of control cells; Ctrl indicates empty vector infection + vehicle; RNAi-2 indicates shRNA-2 infection + 5 mM NIA treatment; and RNAi-3 indicates shRNA-3 infection + 5 mM NIA treatment.

