Figure 3.
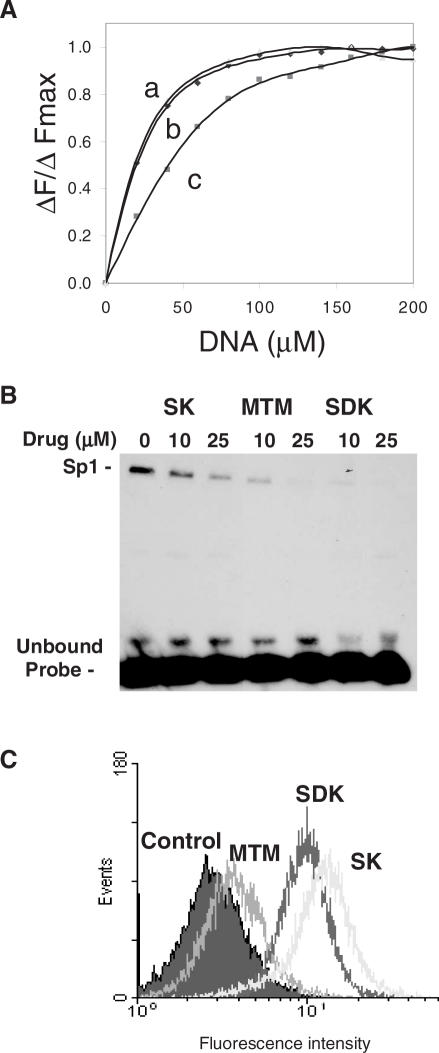
DNA binding, inhibition of Sp1 binding and cellular uptake of MTM analogs. (A) Fluorescence spectroscopy. Normalized changes in fluorescence intensity of MTM (curve a), SDK (curve b), SK (curve c) are plotted as a function of increasing concentration of salmon sperm DNA. (B) Gel mobility shift assay. The biotin-labeled duplex oligonucleotide with an Sp1 binding site was incubated with MTM, SK and SDK at concentrations of 0, 10 and 20 µM for 1 h prior to the addition of nuclear extract. Samples were incubated for 20 min and analyzed on a non-denaturating polyacrylamide gel. The position of Sp1–DNA complex and unbound probe are indicated. (C) Flow cytometry analysis of drug uptake. Cells were incubated with 100 µM of MTM, SK and SDK. After 4 h, cells were harvested, repeatedly washed with ice-cold PBS and analyzed by FACS to determine the amount of compound accumulated in cells.

