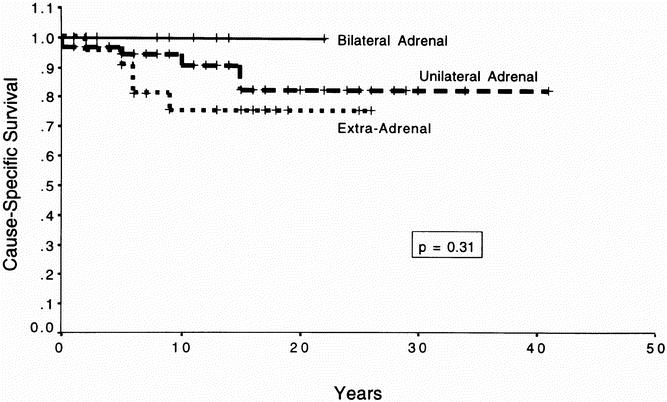
Figure 4. Cause-specific survival. This figure depicts the Kaplan–Meier survival curve for all patients with pheochromocytoma dying specifically from pheochromocytoma. The patients were divided into categories based on whether they underwent bilateral adrenalectomies, unilateral adrenalectomies, or resection of extraadrenal pheochromocytomas. The survival times of the individual groups were compared using the log-rank test; p = 0.31, indicating that there was no statistical difference in the survival time between groups.
