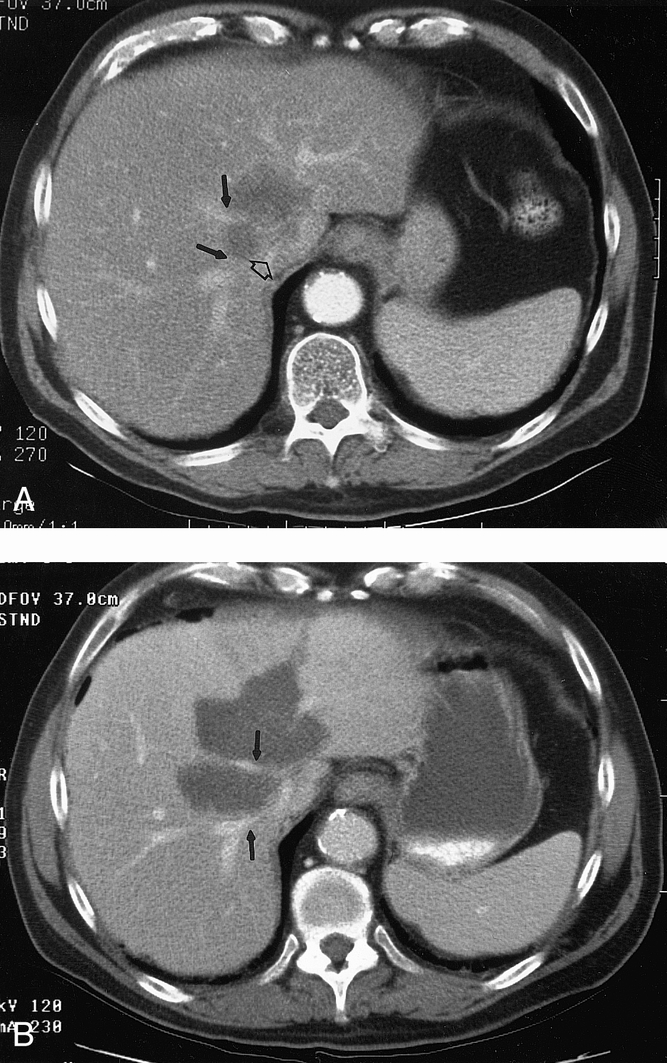
Figure 5. (A) Pretreatment CT scan in a patient with HCC near the inferior vena cava (open arrow) and the right and middle hepatic veins (solid arrows). (B) CT scan 3 months after intraoperative RFA of the liver tumor. Again, the RFA lesion is larger than the original treated tumor. Complete necrosis of tumor is noted, but the right and middle hepatic veins (solid arrows) are patent.
