
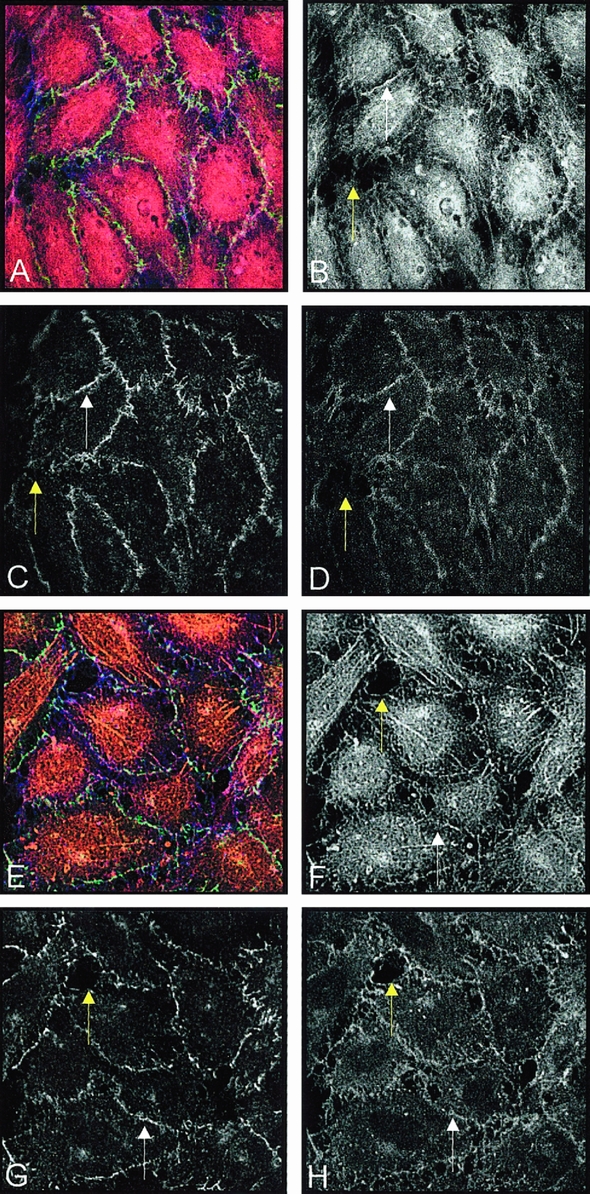
Figure 6. (A) After 3 hours of UW treatment; color projection of (B) actin, (C) occludin, and (D) VE-cadherin. White arrows indicate DPB in B and same area in C and D. (E) After 6 hours of UW treatment; color projection of (F) actin, (G) occludin, and (H) VE-cadherin. White arrows indicate DPB in F and same areas in G and H. Yellow arrows indicate one of several gaps in the monolayer B–D, F–H.