
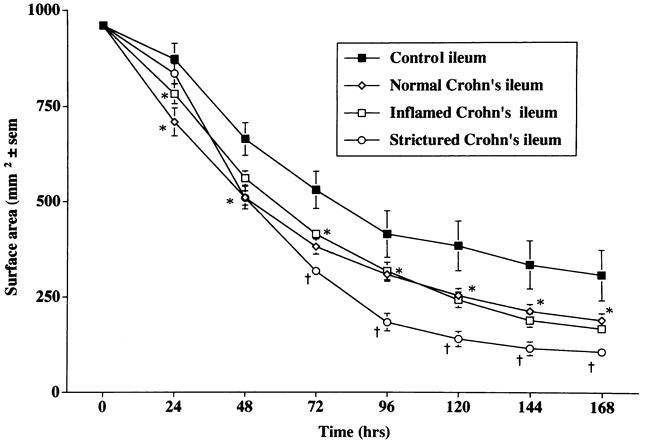
Figure 4. Comparison of the rate of contraction of fibroblast-populated collagen lattices prepared with fibroblasts cultured from control ileum (n = 25), macroscopically normal Crohn’s ileum (n = 18), macroscopically inflamed Crohn’s ileum (n = 26), and strictured regions in Crohn’s ileum (n = 12). Mean ± SEM. *P < .05 vs. control ileum; †P < .05 vs. control, macroscopically normal, and macroscopically inflamed ileum.