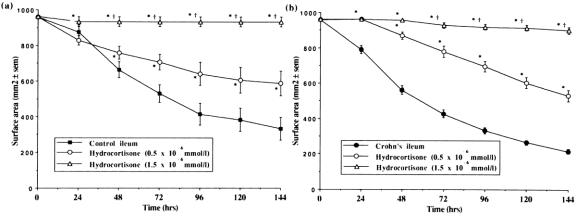
Figure 6. Comparison of the rate of contraction of fibroblast-populated collagen lattices prepared with fibroblasts cultured from (A) control ileum (n = 16), and (B) Crohn’s ileum (n = 44) after addition of hydrocortisone at either 0.5×10⁻⁶ mmol/L (n = 8, n = 19) or 1.5×10⁻⁶ mmol/L (n = 8, n = 19), respectively. Mean±SEM. *P < .05 vs. no hydrocortisone; †P < .05 vs. hydrocortisone 0.5×10⁻⁶ mmol/L.

An official website of the United States government
Here's how you know
Official websites use .gov
A
.gov website belongs to an official
government organization in the United States.
Secure .gov websites use HTTPS
A lock (
) or https:// means you've safely
connected to the .gov website. Share sensitive
information only on official, secure websites.
