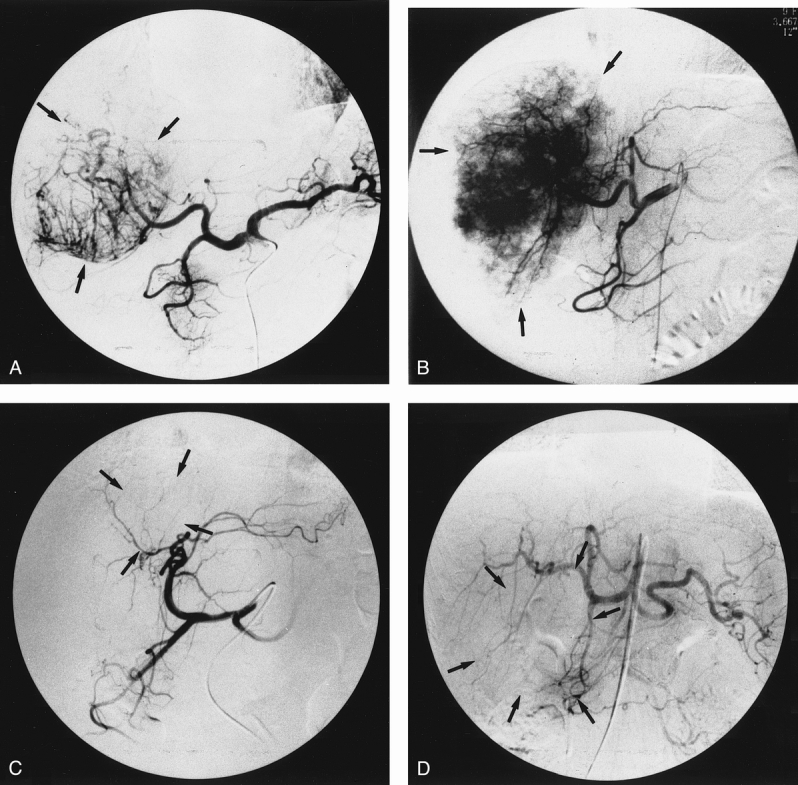
Figure 3. Hepatic angiograms through the celiac trunk with the catheter tip positioned in the common hepatic artery, showing the degree of tumor-staining intensity in patients 7, 8, 21, and 22. (A) Angiogram of patient 21, exhibiting strong tumor staining; human macrophage metalloelastase (HME) and vascular endothelial growth factor (VEGF) tumorous/nontumorous (T/N) ratios were 0 and 0.79, respectively. (B) Angiogram of patient 22, showing the strongest tumor staining; HME and VEGF T/N ratios were 0 and 1.2, respectively. (C) Angiogram of patient 7 and (D) angiogram of patient 8, both showing weak tumor staining; HME and VEGF T/N ratios were 5.67 and 0.91 respectively in patient 7 and 3.69 and 2.15 respectively in patient 8. Tumor location is denoted by the arrows.
