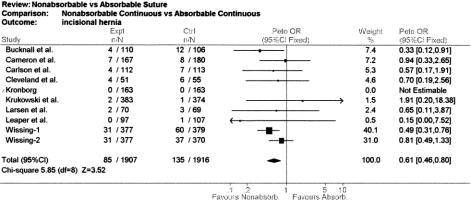
Figure 4. Pooled estimates of incisional hernia comparing continuous nonabsorbable versus continuous absorbable closure. Squares indicate point estimates of odds ratios, with the size of the square representing the weight of each study. Horizontal bars signify 95% confidence intervals. The summary odds ratio is represented by the diamond; values to the left of the vertical bar favor the continuous nonabsorbable group and values to the right favor continuous absorbable.

An official website of the United States government
Here's how you know
Official websites use .gov
A
.gov website belongs to an official
government organization in the United States.
Secure .gov websites use HTTPS
A lock (
) or https:// means you've safely
connected to the .gov website. Share sensitive
information only on official, secure websites.
