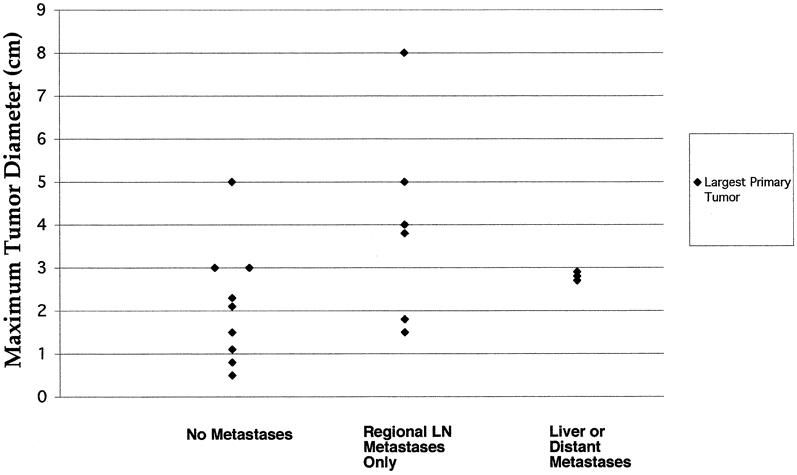
Figure 2. Scatter plot depicting the relation between the maximum diameter of the largest primary tumor and the presence of regional lymph node (LN) or distant metastases. There was significant overlap between all groups. The relation between tumor size and the presence of metastases (group I = no metastases, group II = LN metastases plus distant metastases) was not significant (P = .1135, Mann-Whitney test).
