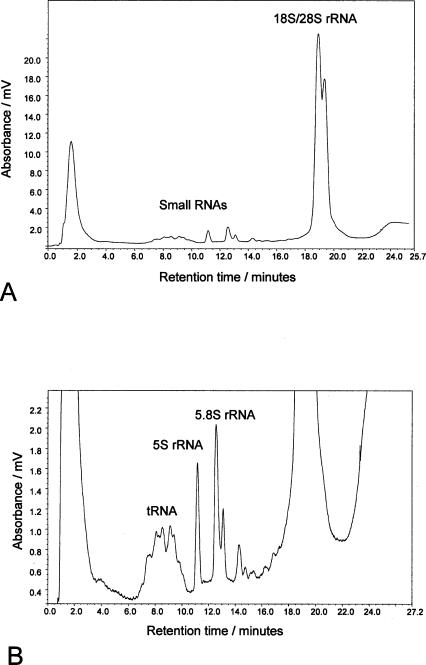
FIGURE 3.
IP RP μHPLC chromatogram of eukaryotic total RNA. The chromatogram shows the analysis of 9.2 ng total RNA extracted from Hela cells using gradient 4 (see Materials and Methods). A shows the typical profile of the early eluting small RNA species and the later coeluting 18S and 23S rRNA. B shows an enhanced view of the smaller RNA species. The tRNA, 5.8S, and 5S rRNA are highlighted.

