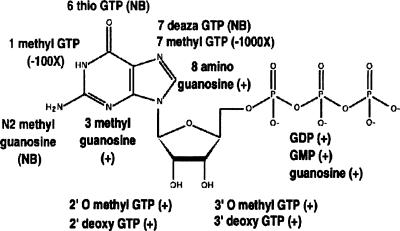
FIGURE 5.
Class I GTP analog binding. The analog binding results from J.M. Carothers, S.C. Oestreich, and J.W. Szostak (in prep.) are summarized in this diagram. The numbers in parentheses are the fold reduction in binding affinity. NB signifies no binding detected. Plus sign (+) denotes that the aptamer Kd for the analog was not more than 100-fold worse than the aptamer Kd (76 nM) for GTP.

