
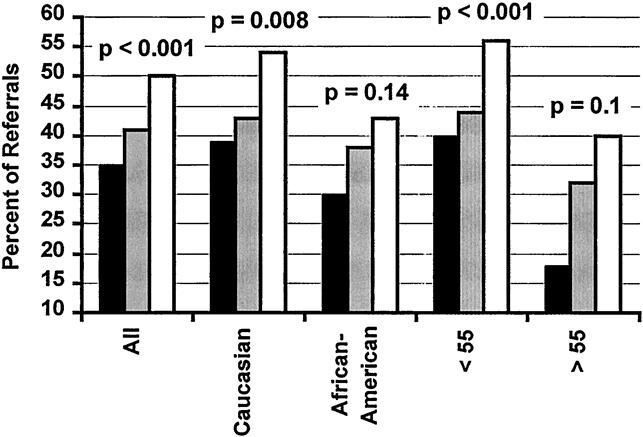
Figure 1. Percentage of kidney transplant referrals who had at least one potential live kidney donor tissue-typed. Black bar, group 1 (open donor nephrectomy, no formal family education program); gray bar, group 2 (open donor nephrectomy with formal family education program); white bar, group 3 (laparoscopic donor nephrectomy with formal family education program). P values refer to a chi-square comparison of groups 2 and 3.