
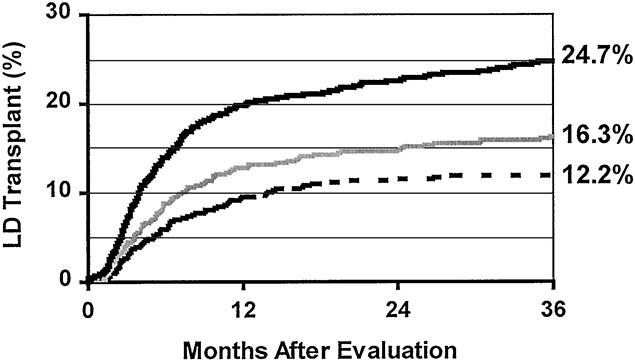
Figure 2. Kaplan-Meier rates of living donor transplantation among all kidney registrants. The lowest rate was for group 1 patients (dashed line). The transplant rate was higher after introduction of the formal family education program (gray line, group 2;P = .08 vs. group 1, log-rank test). The rate again increased significantly with the addition of laparoscopic donor nephrectomy (black line, group 3;P < .0001 vs. group 2).