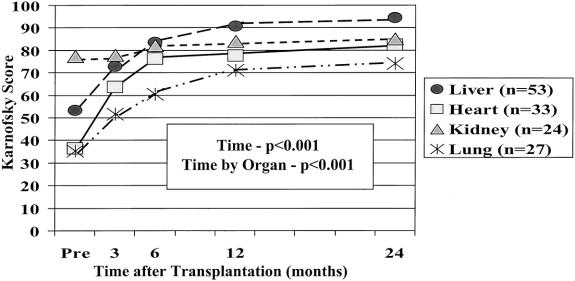
Figure 1. Karnofsky Performance Status over time by type of organ transplanted. Graph demonstrates the difference in pretransplant performance status, with future lung and heart patients on average being disabled, liver transplant patients being unable, and kidney recipients being able. All patients improved over time, but their trajectory of improvement differed. All types ended up in the able category .

An official website of the United States government
Here's how you know
Official websites use .gov
A
.gov website belongs to an official
government organization in the United States.
Secure .gov websites use HTTPS
A lock (
) or https:// means you've safely
connected to the .gov website. Share sensitive
information only on official, secure websites.
