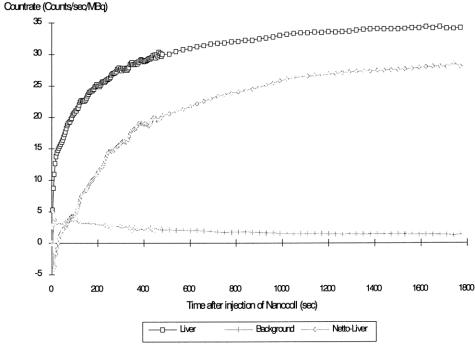
Figure 2. Count rates of the regions of interest placed above the liver and the abdomen (background radiation) and calculation of the resulting net liver uptake curve after injection of 20 MBq 99mTc–Nanocoll, according to Baas et al. 16

An official website of the United States government
Here's how you know
Official websites use .gov
A
.gov website belongs to an official
government organization in the United States.
Secure .gov websites use HTTPS
A lock (
) or https:// means you've safely
connected to the .gov website. Share sensitive
information only on official, secure websites.
