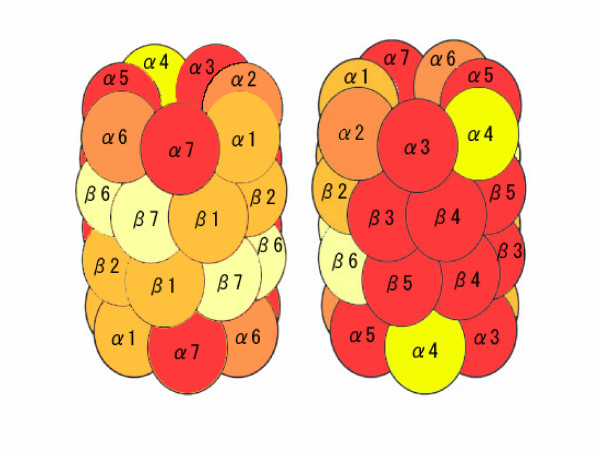
Figure 9.
The relationship of gene expression and subunit of 20S proteasome. This figure shows a section of genes classified by using BL-SOM clustering based on microarray data corresponding to a structure of 20S proteasome complex. α3, α5, α7, β3, β4, and β5 included in cluster 4-1 are shown in red. α1, β1, and β2 included in 6-1 are in orange. α1 and α6 included in cluster 4-1 and 6-1 are in bright orange. α4 included in cluster 3-0 is shown in yellow and β6 and β7 included in cluster 5-0 are shown in maize.

