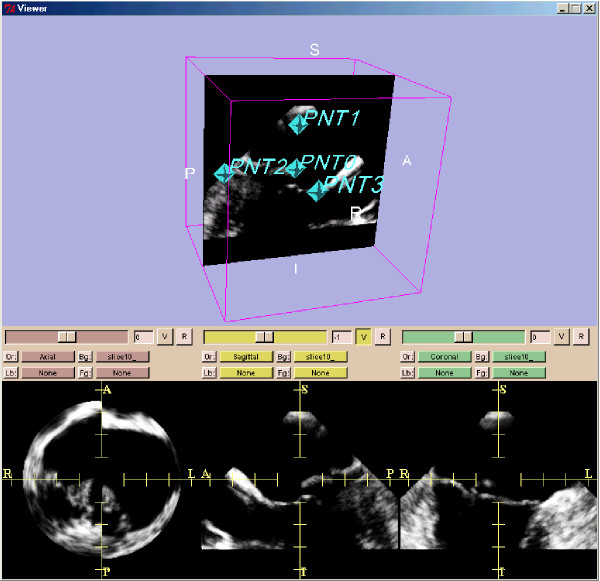
Figure 3.
Ultrasound data of after preprocessing. The ultrasound data are shown from patient 1. Shown is a standard visualization of one time step during the heart cycle with 3D Slicer 2 software. The three planes for each spatial direction are shown in the lower three frames. In the frame above one plane is shown together with the set of four fiducials. These four points are defined for all time steps.

