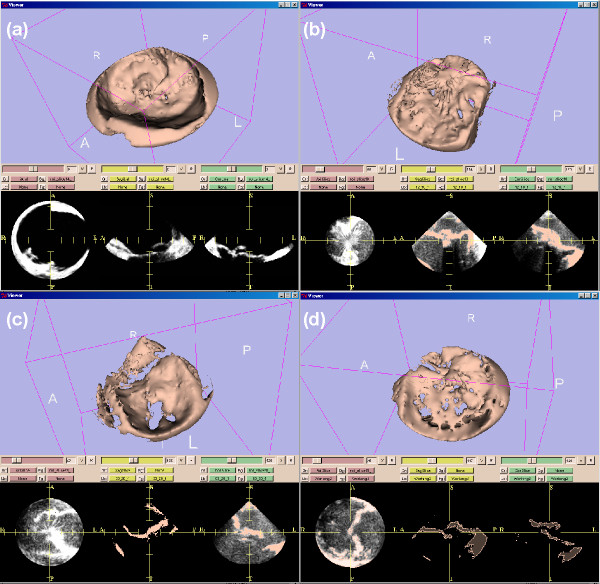
Figure 5.
3D FEM models at systole for the three data sets. (a) patient 1, (b) patient 2, (c) and (d) patient 3 at two different time steps in the cardiac cycle. Here a smoothing factor [13] of 20 and a decimation factor [13] of 20 were applied in order to obtain FEM models with a reasonable number of FEM triangles for further processing. 3D FEM model of the same data set as in Figures 3 and 4. The three planes (some with level sets) for each spatial direction show the cutting planes through the model. No smoothing or decimation was applied.

