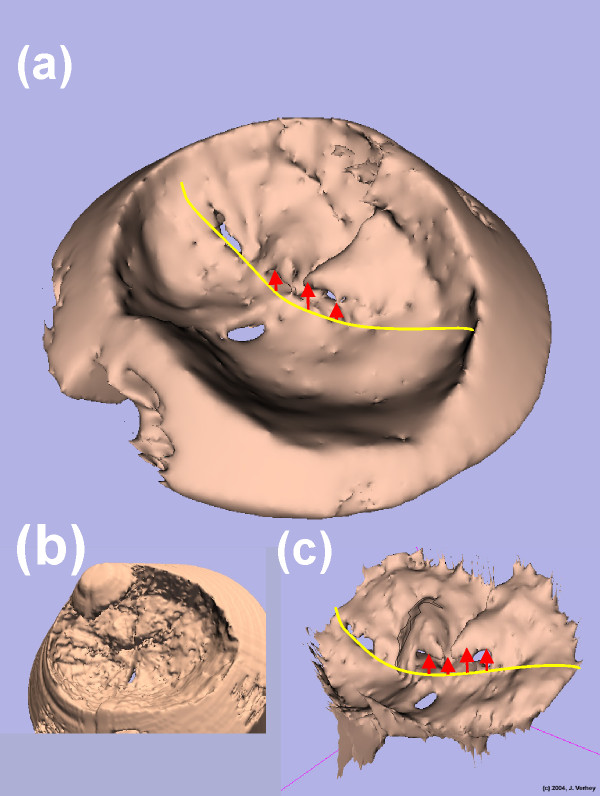
Figure 6.
Models from a patient using different parameters and techniques. In this figure FEM models from patient 1 are shown in different manners. (a) is the smoothed and decimated model shown in Figure 5 (a). In addition the yellow line indicates the leaflets border. The red arrows indicate the prolapse of the mitral valve leaflet. (b) is a model where no ROI was applied so the full (and unnecessary) ultrasound cone is visible. (c) shows a model based on a very time consuming manual segmentation.

