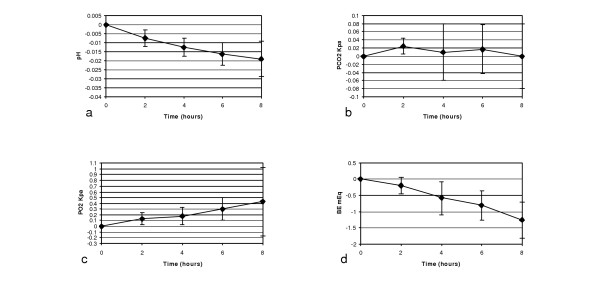
Figure 2.
Changes in arterial blood gases over 8 hours for protocol 1. Mean changes over 8 hours, measured every 2 hours (protocol 1): (a) pH, (b) PCO2, (c) PO2, (d) Base Excess (BE). Note the different scales. PO2, pH, and BE show changes outside the error range for the blood analyzer. However, PCO2 variations are within the range of instrument error. Ranges represent ± 1 SD.

