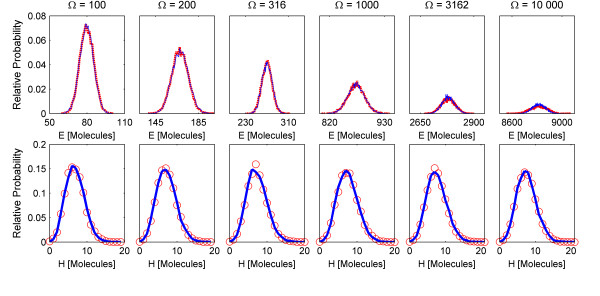
Figure 4.
Probability Distributions of the Non-Linear Cycle Test. Probability distributions of species (Top) E and (Bottom) H of the Non-Linear Cycle Test at a time of 10 seconds for increasing system sizes, ranging from 100 to 10 000. The chemical Langevin and differential Jump equations are integrated using a fixed Euler-Maruyama scheme with a time step of 0.01 seconds. All other parameters are set to default values.

