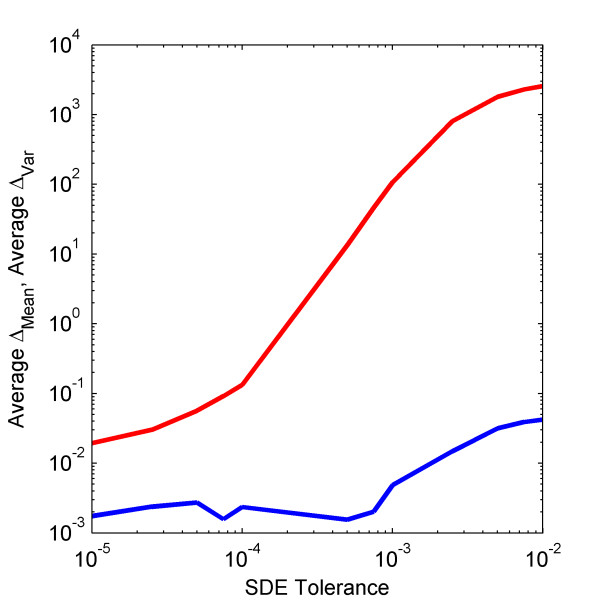
Figure 7.
Effect of adaptive scheme's user-defined tolerance on weak mean and variance errors. The average normalized weak (blue) mean and (red) variance errors of the Non-Linear Cycle Test with a system size of 10 000 using the adaptive time step Milstein scheme with user-defined SDE tolerance values ranging from 10-2 to 10-5. All other parameters are set to default values.

