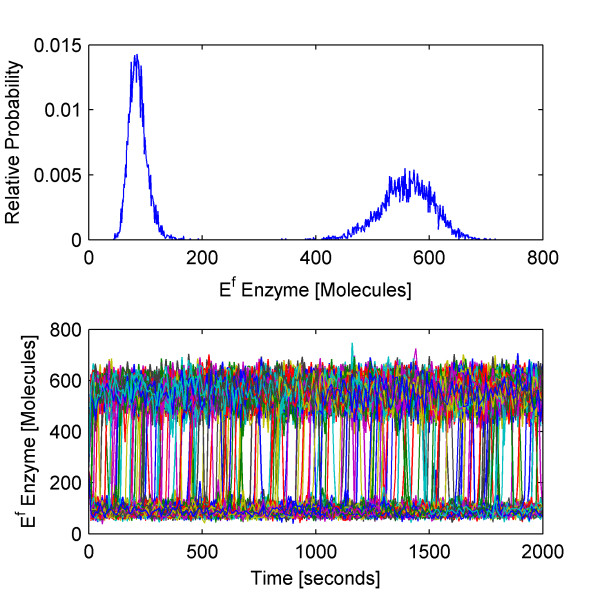
Figure 8.
Distribution and trajectories of the Schlogl reaction module(Top) The relative probability distribution of the number of Ef molecules at 50 seconds. (Bottom) Out of 10 000 independent trajectories, the 225 shown here exhibit spontaneous transitions from low to high or high to low numbers of Ef molecules.

