
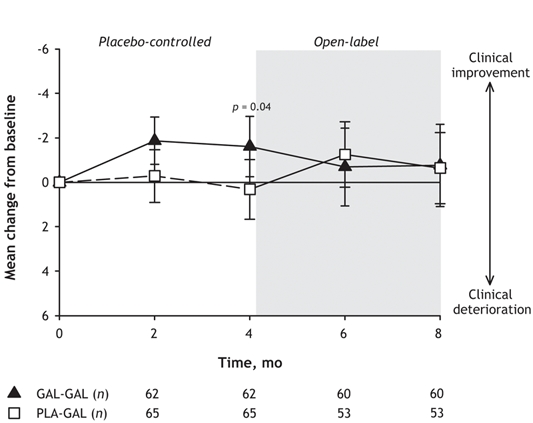
Fig. 3: Mean change in the ADAS-cog (cognitive subscale of the Alzheimer's Disease Assessment Scale) scores, by treatment group. Error bars represent 95% confidence intervals. See Fig. 2 for description of GAL-GAL (black triangles) and PLA-GAL (white squares) data sets. (Missing data were imputed based on the last observation carried forward, excluding baseline data; for the comparison between groups in the open-label phase, only observations in the galantamine group during the placebo-controlled phase were carried forward.)