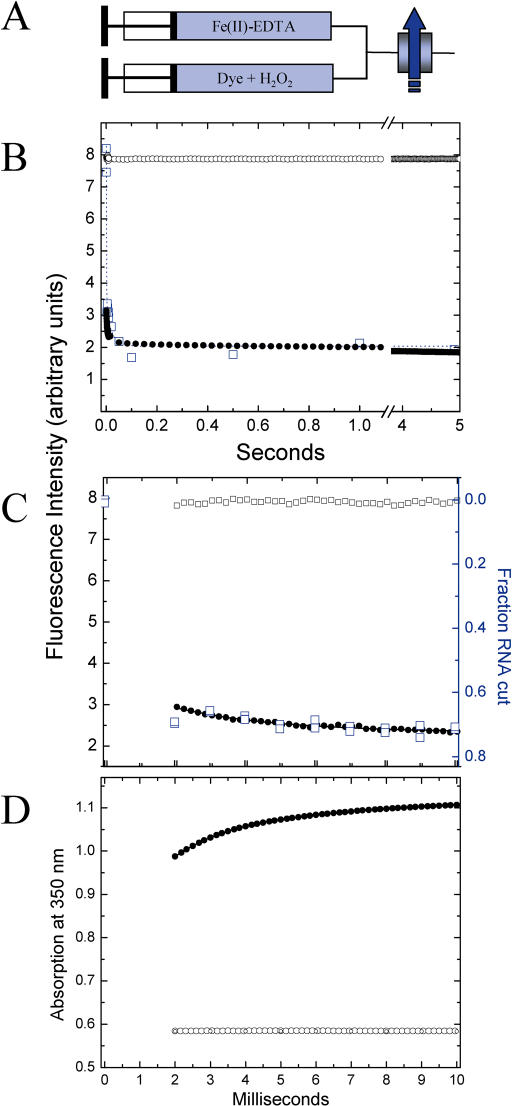
Figure 1.
(A) Schematic representation of the stopped-flow mixing experiments. The arrow indicates fluorescence detection; (B and C) Quantification of ·OH production by loss of fluorescence emission of fluorescein following the mixing equal volumes of solutions containing Fe(II)-EDTA and H2O2 in assay buffer at 25°C to final concentrations of 10 and 133 mM (0.45%), respectively. (C) is an expansion of the first 10 ms of (B). The closed symbols track the oxidation of fluorescein. The open symbols depict the control in which the fluorescein and H2O2 were mixed with buffer. Five ‘shots’ were averaged. Every second and fourth data point is displayed in (C) and (D) for clarity. The blue open squares in (B) depict the fluorescein oxidation experiment conducted in the quench-flow mixer. The blue open square symbols in (C) depict the cleavage of 32P-RNA in the quench-flow mixer. The solid line depicts the best fit of an exponential decay to the stopped-flow fluorescence data over the 10 ms duration shown in (C) with y0 = 2.326 ± 0.007; A = 1.143 ± 0.028 and t = 3.0 ± 0.1 ms; (D) Direct measurement of the oxidation of 1 mM Fe(II) to Fe(III) by 44 mM H2O2 by following the absorption increase at 350 nm (33). The 350 nm wavelength is on the shoulder of the iron-chelator absorption spectrum separate from H2O2 absorption. The data are best fit to a bi-exponential decay with y0 = 1.129 ± 0.002; A1, t1 = −0.265 ± 0.002, 1.45 ± 0.01 ms; A2, t2 = −0.101 ± 0.002, 6.57 ± 0.04 ms. Reactions involving Fe(II), Fe(III) and H2O2 and their products in addition to reaction 1 have been documented at the reagent concentrations being used in this footprinting protocol (25) and are the likely source of observed multiple kinetics phases. These additional reactions are not considered herein since the slower kinetic phases do not significantly contribute to the footprinting reaction.

